
Home Business Intelligence Dashboards
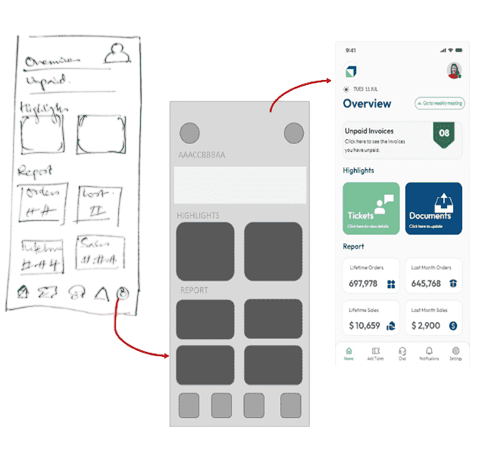
Join other Companies who Partnered with us!




















Want to Know more? Have some questions about Actiknow?
Try our answers.
Our Competitive Edge:
- Custom-Tailored Dashboards – Built to meet the unique needs of businesses across industries.
- Seamless Data Integration – Connects with multiple data sources, including ERP, CRM, and cloud databases.
- Real-Time Insights – Monitors performance metrics and KPIs in real time.
- Predictive Analytics & AI Integration – Uses machine learning models for proactive decision-making.
- Cloud-Based & Scalable – Ensuring access from anywhere with secure cloud infrastructure.
Steps to Get Started:
- Consultation & Requirement Analysis – Understanding your data needs and business goals.
- Data Integration & Transformation – Connecting and cleansing data from multiple sources.
- Custom Dashboard Development – Designing user-friendly interfaces tailored to your business.
- Testing & Optimization – Ensuring performance, accuracy, and security compliance.
- Deployment & Training – Launching the dashboard with full team training and ongoing support.
Popular BI Platforms:
- Power BI: Microsoft’s cloud-based solution for data visualization and reporting.
- Tableau: Industry-leading BI tool known for interactive analytics and dashboards.
- Google Data Studio: Free and user-friendly platform for integrating Google-based data.
- Looker: Advanced data exploration and embedded analytics solution.
- Domo: Cloud-first BI tool with real-time insights and mobile accessibility.
- Custom BI Solutions: Tailored analytics platforms built for enterprise needs.
Our BI Dashboard Development Process:
- Discovery & Planning – Understanding business goals and defining key metrics.
- Data Collection & Processing – Extracting and structuring data from multiple sources.
- Dashboard Design & Development – Building intuitive, interactive visualizations.
- Testing & Optimization – Ensuring accuracy, performance, and security.
- Deployment & User Training – Ensuring successful adoption and continuous improvement.
Why Choose ActiKnow Over Competitors?
- Industry-Specific Expertise – Tailored BI solutions for finance, healthcare, retail, and more.
- Data-Driven Automation – AI-powered analytics for smarter decision-making.
- Security & Compliance – Ensuring GDPR, HIPAA, and ISO standards are met.
- Custom UX/UI Design – Creating dashboards that are both powerful and user-friendly.
- Ongoing Support & Scalability – Continuous improvements and future-proofed solutions.
Let’s Talk Data! Contact ActiKnow today for a free consultation and discover how our BI dashboards can drive your business forward.
Read Our Business Intelligence Dashboard Success Stories and case Studies
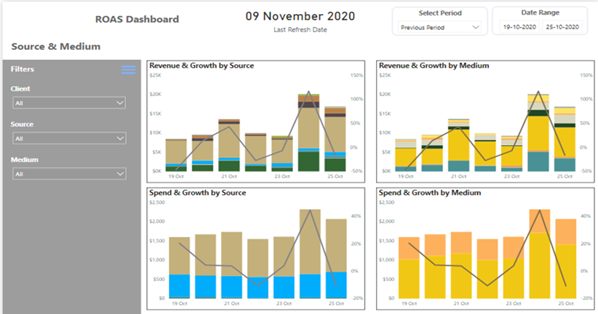
Actiknow’s Power BI dashboard helped us gain complete control over our ad spend and revenue.....


Business Intelligence Dashboards Guides and Articles by Our Team

Define dashboard data freshness SLAs using decision needs, source latency, pipeline duration, recovery targets, ownership, monitoring and escalation instead of vague “real-time” requirements.
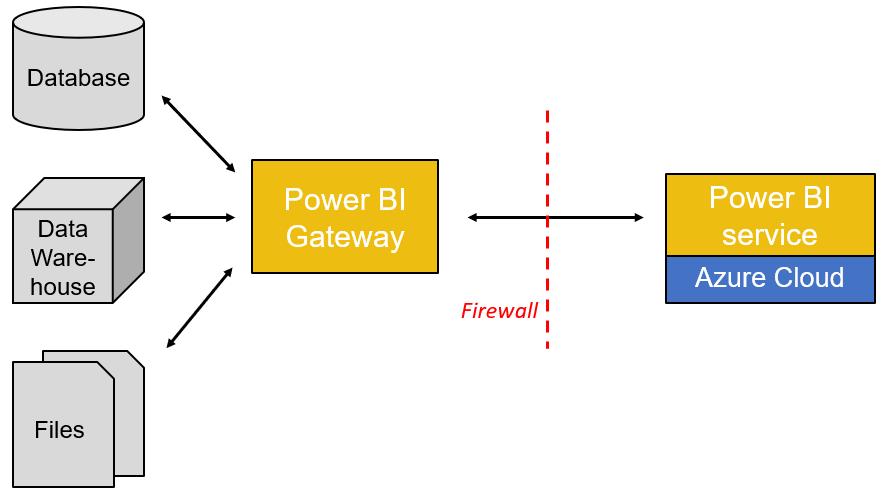
Design a reliable Power BI gateway architecture with clustering, service accounts, network planning, credential ownership, monitoring, refresh recovery and security controls.
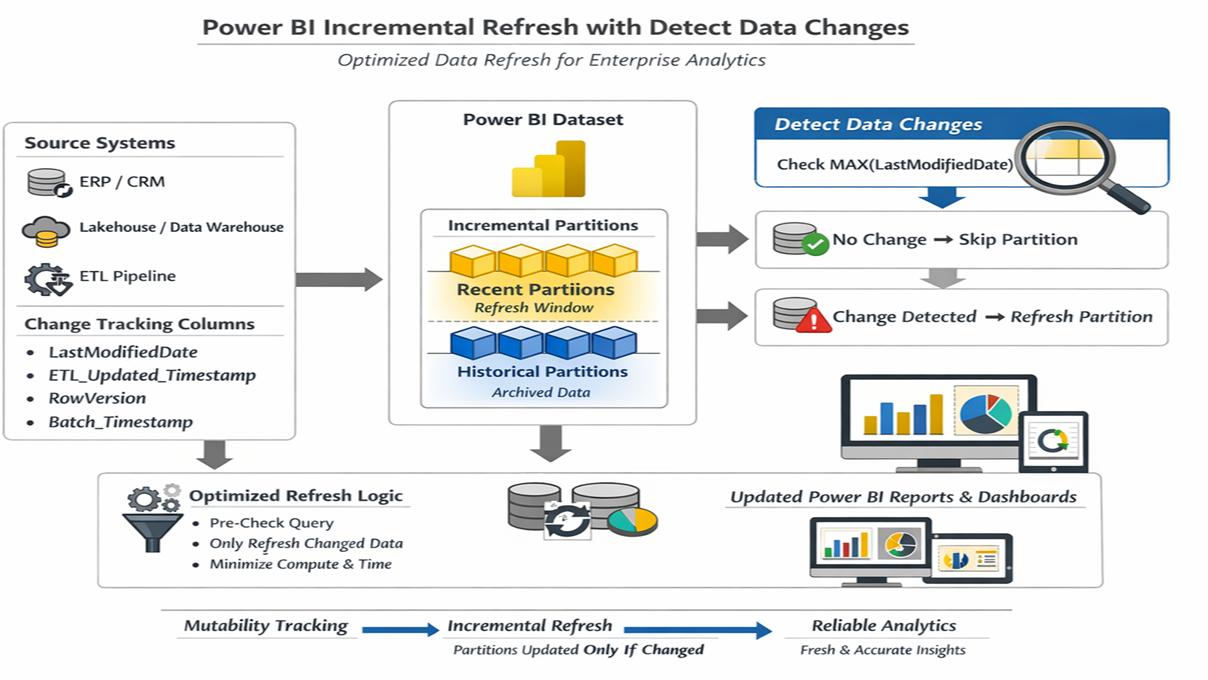
Learn when Power BI incremental refresh reduces refresh time, how partitions and change detection work, what source prerequisites matter, and when it will not solve refresh problems.
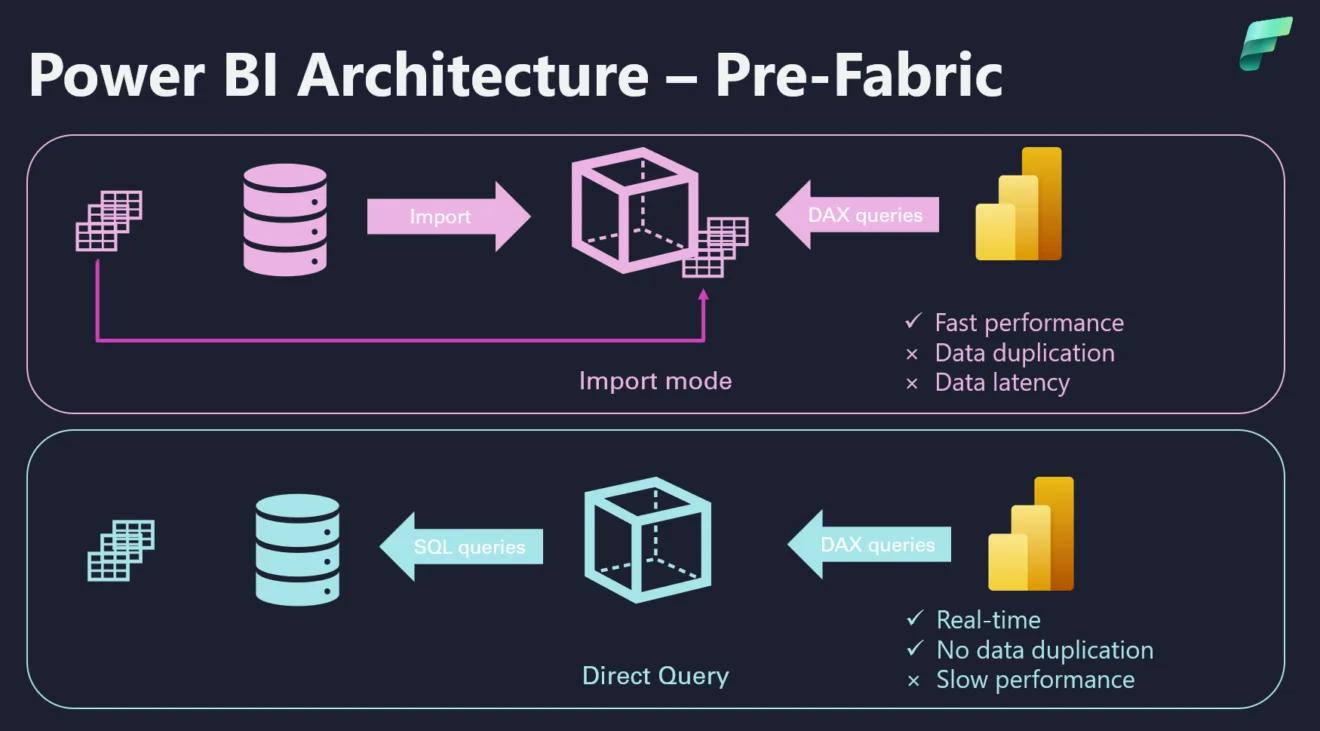
Compare Power BI Import vs DirectQuery based on data freshness, source performance, concurrency, model size, security, refresh operations and user experience.
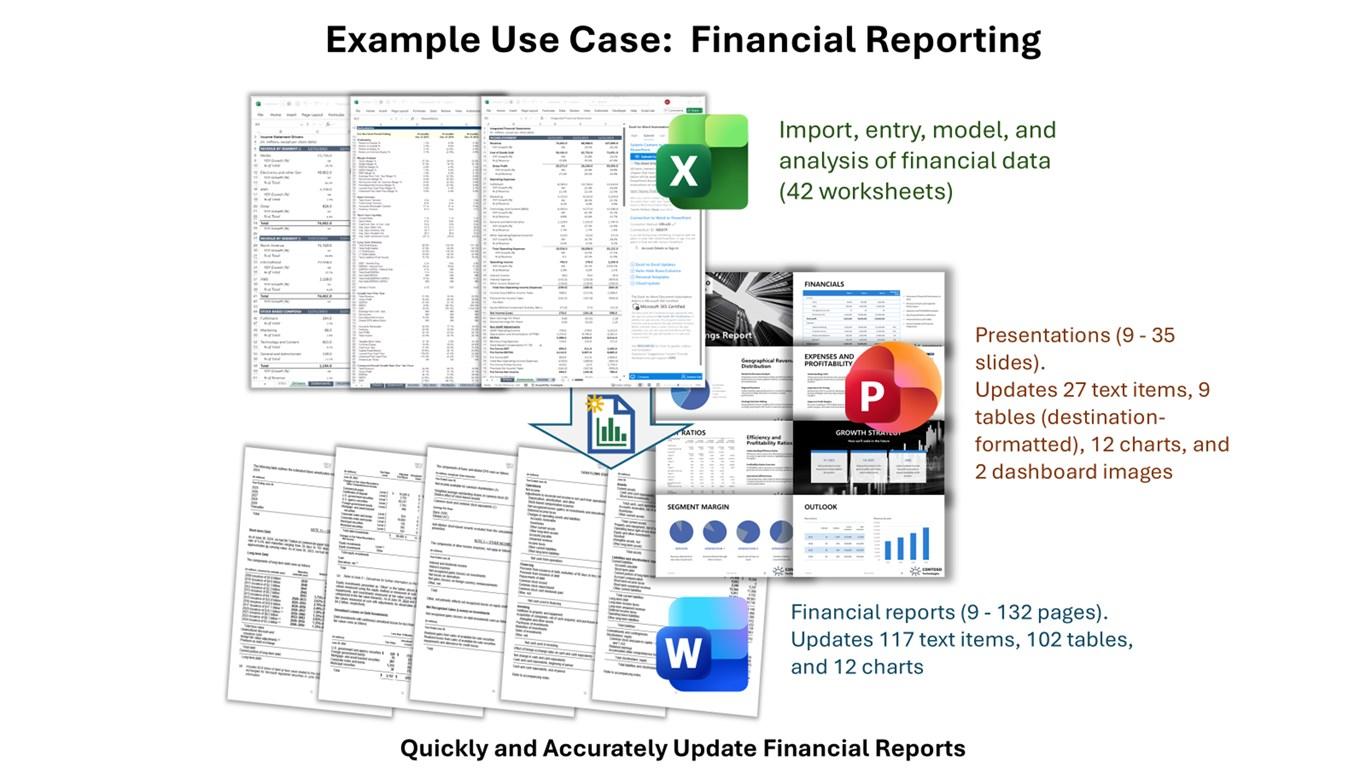
Learn how to automate Word reports from Excel while preserving template control, validated inputs, version history, approvals, reproducibility and a clear audit trail.

Learn how to design a semantic layer that keeps KPI definitions consistent across dashboards, self-service analytics and AI querying, with clear ownership, testing and governance.

Learn how to design data quality monitoring for revenue reporting using freshness, completeness, uniqueness, reconciliation, anomaly and ownership controls.

Compare Looker Studio vs Power BI for marketing reporting across connectors, governance, sharing, modeling, automation, cost, and long-term reporting effort.

Planning a Tableau to Power BI migration? Audit dashboards, calculations, data models, permissions, licensing, performance, adoption, and cutover risk before rebuilding reports.

Learn how to design, test, and govern Power BI row-level security for regional, departmental, and customer-specific access without creating fragile reporting logic.